
At first glance it may sound strange, producing less content to improve conversions. We are always preaching that “content is king,” “those who are not seen are not remembered,” and the like. These “sayings” remain valid. What we have to demystify is the need to produce a lot of content to get conversions.
Index
To the unsuspecting reader, I am a fan of holistic SEO. This article, therefore, deals with SEO, analytics, and other areas, in content production strategy.
Many publishers have chosen to produce less content and are experiencing an increase in their conversion rates (registrants, subscribers, buyers, etc). But how is this possible? What are the impacts of SEO? How to measure these results?
I will address these and other topics but first, we need to understand a little bit why this is happening.
Changes in media consumption
Remember when you or your parents used to buy printed newspapers? Do you remember that the Sunday edition was twice the size of the weekly daily edition? It was also more expensive.
The newspaper, like a printed magazine, is judged not only on its journalistic quality but also on its size. In print, size, paper quality, and finish are all factors that influence the perception of value.
Take for example a collection of Vogue magazines. It is one of the largest magazines I have ever seen (in issue size).

There is a lot of “value” involved! It is not just a magazine. It is a fashion almanac. Some issues have more than 300 pages.
This perception of value based on something physical (volume, texture) is something we don’t have in digital. It is not only the consumer who has lost that feeling. Media, especially print dissidents, are so used to this idea of value = volume that they keep it in their publishing routine.
With the arrival of the Internet, vehicles saw their advertising revenues plummet. Instead of improving their publications, the vehicles opted to publish more and more in search of visibility, especially on social networks.
This didn’t only happen with newspapers and magazines, which started publishing any crap in the format of lists or series just to have volume. It has also happened with science.
In the old days, great articles were the fruit of a lifetime of dedicated study. Today, we have the so-called “salami science” (the term has been used for at least 30 years but I don’t know the origin). It refers to the fact that you take a discovery and “slice” it into as many scientific articles as possible. The reader is forced to put all the articles together to fully understand their content.
On the Internet, this (excessive) volume of articles is not value, but noise.
Articles more important than publications
A superficial analysis of on and off-line reading behavior is enough for us to understand why articles have gained more relevance than publications.
The way people consume a content on the Internet is very different from reading a printed newspaper or magazine. To read a magazine, you sit down on a comfortable sofa (at home or in some waiting room) and start flipping through it.
Will you read every page with the same attention? Of course not, and the magazines know it. You will probably see a lot of ads on the first pages, articles in the middle, and pictures or other things at the end. This is the content distribution pattern of many magazines.
Will an article on page 30 of the magazine and one on page 100 receive the same attention from the reader? Probably not, but we won’t know that offline. If we cannot measure this, it is acceptable to say that all pages will have the same value and that ads will have the same visibility regardless of which page they are on.
And suddenly we have digital. Where we can measure everything, for every page. Pageviews, screen scrolling, time on page, bounce rate, and ad viewability are some indicators.
Good for the publishers?! No doubt about it. But with a few surprises.
Browsing the Internet, instead of looking at the whole publication (set of articles), people read two or three articles and already go to another site.
The incentives (links, banners, layouts, CTAs) to get out quickly are many and available all the time.
Read also: How to prioritize content production in an SEO strategy
Social Networking and UI Interference
Many vehicles are conducting tests and stopping using Facebook for activation of the articles produced. In some segments the change in consumption patterns is great. Some vehicles reported 42% more engagement time from their readers and 12% more pages per session.
There was also a change in the type of content people were reading. In many segments traffic via social has less engagement than traffic coming from organic search. With Facebook, traffic tends to be concentrated around a few articles. Without Facebook the distribution is more homogeneous.
Facebook is a great channel for some factual, bait-and-switch, and viral. This creates an audience that has very low loyalty and is not really willing to read the entire content of the article or vehicle.
The problem is not only with Facebook (or other networks). The way the pages are constructed creates the same effect. Choosing a layout that prioritizes the articles at the top or above the fold will boost the articles displayed there.
We arrive at the unfortunate result that few articles receive a giant volume of traffic while others receive almost nothing.
Internal competition (keyword cannibalization)
Another problem with producing content without proper planning is internal competition.
Keyword cannibalization, as it is known among SEOs, basically consists of ranking different pages for the same keyword. We say that cannibalization occurs when two or more pages compete with each other and one hurts the other’s search ranking.
A site can present, for a search term, pages in the 2nd and 3rd search positions but not in the 1st.
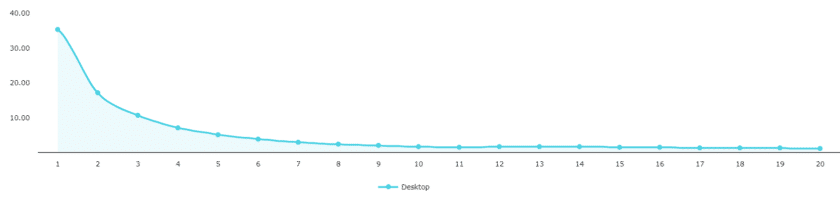
Since the average CTR of the first position is 35% and the CTRs of the 2nd and 3rd position 17% and 10% respectively, we can conclude that it is advantageous to have one URL in the 1st position than two in the other podium positions.
Monetization
In print we had the revenue assigned to the publication as a whole, not per page. In digital, we have a way to know how much each individual article earned.
For advertising we can measure exactly the revenue of each page. For subscribers just divide the subscriber revenue by the volume of subscribers who have seen a particular article. This will give you the recipe per article.
Article revenue = article advertising revenue + (total revenue from subscribers / no. of subscribers who viewed the article)
You will find that some articles are much more profitable than others, and if you calculate the cost of production per article, you will see that some are making a loss.
Improving Conversions
Fair enough. We know that articles can have value from advertising, from the subscriber, both, or have no value at all. Let’s put this into a content segmentation matrix:
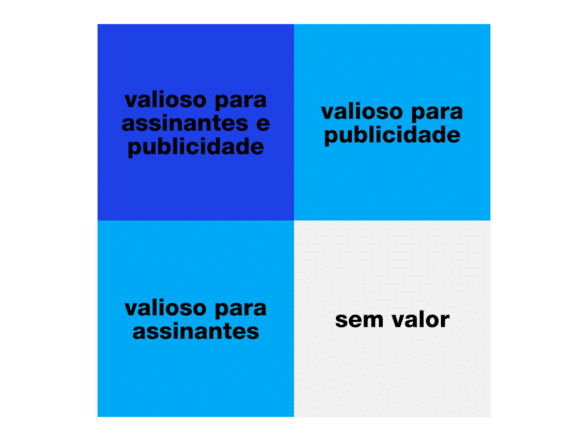
Pay attention to the last segment (no value). These are the articles that do not bring profitable results from advertising and neither from subscribers.
This analysis has already been done by many vehicles, especially newspapers.
The Guardian in 2019 cut a third of its weekly publications, and not only did no one notice, but its traffic went up.
Between 2017 and 2019 Le Monde reduced the volume of articles by 25% and its audience increased by 11%.
The Post and Courrier has reduced its daily publication from 65 to 30 stories a day and increased its subscription volume by 250% in two years.
Similar results were obtained by The Times and others. More details in this Digiday article.
Read also: Objectivity and journalistic perspective
Why is this happening?
Largely for three reasons:
- Online people can’t see the volume of things. For example, when The Guardian cut a third of its content, nobody noticed.
- The content that these vehicles cut was all low performance, the kind of content that generated neither advertising revenue nor subscriber traffic.
- they have not only cut out the worthless content, they have also improved the quality of the content produced.
Read also: What is it and how to create quality content?
In most of my consultancies I encounter the following situation regarding the content produced:

That is a problem.
Not only are there a disproportionate amount of articles that people have no interest in, but there are also few articles that are valuable for subscribers and for advertising. This leads editors to have two separate editorial focuses at the same time.
See it’s not just about cutting out the “worthless” ones, we have to correct the publishing focus with more relevant content.
Measuring what to keep and what to cut?
Deciding which articles to cut can be simple if you look at metrics like pageviews, for example. But let us refine our understanding.
There are three general metrics that we need to look at:
- Advertising metrics: to identify which articles provide the best advertising revenue.
- Subscription (and churn) metrics: to identify which articles offer the best value to subscribers.
- Editorial metrics: to identify which articles are closest to your editorial purpose, that which defines the vehicle.
We still have a lot of data to keep an eye on and questions we can ask to segment the content produced:
- How long did it take you to write it?
- What was the cost?
- Which journalist (or journalists) wrote it?
- What is the article about? (categories, topics)
- What is the sentiment of the article? (Is it positive or negative?)
- What is the use for the reader?
- To whom is this article relevant? Is it for the individual? Is it for society?
- Is it a real-time report? Something that happened earlier this week? Something that happened a year ago? Timeless?
We also have technical metrics to take into consideration:
- When was it published? (Time of the week, time of day, season of the year)
- How was it published on the site? (Time on the front page, included in newsletters, promoted on social networks, etc.)
- How did people get to him?
- What is the length of the article?
- How long would it take you to read the article?
- What was the total reading time of the article?
- What was the amplification rate?
We still have the subscriber indicators (measured over time):
- What articles did people read before signing up?
- What articles did people see immediately before they subscribed?
- Which articles prompted people to immediately read another article?
- Which articles belonged to a topic that people had read earlier that day or week (indicating that they are coming back to learn more about the topic)?
It may seem like a lot to keep up with, and it is.
Many of these metrics cannot be achieved using Google Analytics (or other analytics tools). Some are even achieved through advanced implementations of these tools, but others are only possible through a specialized CMS (Content Management System).
In Google Analytics we can work with custom dimensions. With them you can collect data such as publication date, author, categories, tags, article size, time to read, etc.
Tools to track all these indicators are expensive. Some of the world’s major vehicles have built sophisticated systems capable of collecting this and other information. Many are relying on machine learning, analyzing behavior patterns to offer more relevant content.
However, for most vehicles this is a distant reality. Many do not even have traffic that can generate enough data for a more accurate analysis.
Look at all these metrics as optional. Focus on the ones you have information available and ignore (for now) the others. Know what is relevant to your business.
What content to cut?
Now it gets interesting. Let’s look at some steps that help in restructuring content production.
Step 1: Define the cost per article
The first step is to identify what the cost per item is.
In a simple editorial office, where the articles have the same size and complexity it will usually be easier to have the estimated cost for their production. In larger teams it is more complex.
In a newspaper, you will most likely have a variable cost per article. Some are quick and easy and can be written by a journalist in the newsroom. Others can take days, involve travel and hotel stays, several journalists, photographers, graphics teams, BI staff, etc.
This makes calculating the cost per item a bit complicated, but you should still have a sense of it.
Step 2: Advertising Revenue
The second step is to look at advertising revenue.
Go to your advertising dashboard and export a file that tells you how much advertising revenue each article made. If not by article, try by subject category. You must have access to this data. This is how advertising revenue is measured.
All you have to do is compare this data with the data from the 1st step and get the “advertising profit per article”.
We can stop here but so far we have only looked at the past. We need to understand the cause (or at least try to).
To do this, let’s go back to those questions I mentioned earlier. “What is the topic?” “Where is the traffic coming from?”, etc.
There is no ready-made formula for this. Every business is different. Some vehicles may have traffic problems in some categories or simply the content covered is not interesting for advertisers.
Step 3: Recipe with signatures
Same analysis as in Step 2 but for subscribers.
I talked about this at the beginning: divide the subscriber revenue by the volume of subscribers who “viewed” a certain article.
The idea here of “viewed” is to use a more relevant metric than simply page view. Which articles did your subscribers actually use or interact with?
We need to define a metric that brings value. We can use either read time or read rate. For this we establish, for example, that an article has been read when the visitor has stayed on the article 80% of the time it took to read it. Or, cross-reference information such as page scrolling and the time required to reach a certain visible percentage of the page.
Just take the monthly subscription revenue and divide it for each article (taking into account how long the article has been on air). The result is, once again, a list of items segmented into “valuable” and “worthless.”
Read also: Digital Marketing Metrics: which ones are important?
Advertising + Subscriptions
Now we have a good sense of which articles produce profit for both advertising and subscriptions, and we identify (or try to) the cause.
Let’s go back to the matrix:
Segment your articles in this matrix. It is clear that an article can be valuable for advertising or for subscribers. There are also those that are for both (very profitable). But we have one group of items that is not so obvious.
It can happen that an article is not profitable from an advertising or subscription point of view, but when we combine (subscription profit + advertising profit) it becomes profitable.
It is very difficult to do this analysis but if you have already gone through the basics, go ahead.
Step 4: Relationship
This step consists of looking at all the items in the “no value” segment. In theory, these are all items (or focus areas) that we should cut, but in practice, it’s not so simple.
To get people to sign up, we need to build a relationship with them. Nobody signs on after reading only one article (unless that article is very good).
So before we cut anything, we need to check if the articles help us build this relationship. What we need to observe are things like:
- Does this article encourage people to come back later?
- Does this article help remind people that we exist?
- Does this article act as a teaser that makes people go to the most valuable areas?
Be critical about this. Just because an article generates traffic does not mean that it is good for your business. Ask yourself if you could do this without this article. Can you direct people’s attention to your landing page without it? Can you use other visual elements to lead them to your subscription page?
Once that analysis is done, what is left is garbage. They produce no advertising revenue, bring no value with subscriptions, and generate no relationships.
Step 5: Editorial Importance
The last step is a reality analysis (a bit different from the other four, which are more data-focused). As an editor, you need to look at the data we have identified in the previous four steps and ask yourself what the editorial focus is.
What defines you? What is the purpose of your publication?
Many vehicles put that content that they only produce when they have nothing else to write (like “culture” or “wellness”) as premium content. It is a mistake. Your most profitable content should be relevant to people. Are you a police newspaper (hard news) and writing about entertainment? Sorry, you need to improve your focus.
If your focus is wrong, just cutting content production won’t help much. In this case you publish too much and you publish it wrong. Think about it.
Less is more
Now is the time to cut content production mercilessly. Most media outlets could cut 80% of their articles, making the other 20% super relevant, and still increase their subscriptions and advertising revenue.
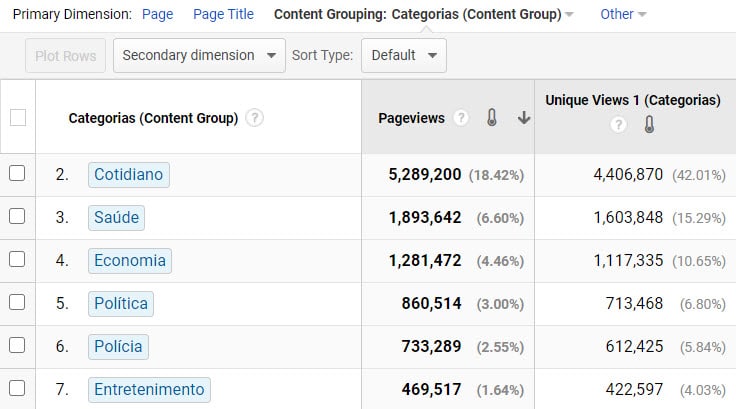
If your value offering is based on “politics” or “economics” but these categories have a read rate (for illustration I will use only pageviews) of less than 3% each, you need to rethink your strategy. It is a very low number.
My recommendation is for your subscribers to consume at least 30% of your most valuable content. 20% minimum.
You will find that producing more assertive content will be more enjoyable for your team and your conversions much better.
If you would like to understand a little more about how aspects of SEO and analytics can improve your content production, please get in touch.
Here’s a summary on how producing less content can lead to more conversions.
Continue reading: SEO and PPC: Combining for Better Results