
What marketing metrics should we track? What do we need to know and how can we improve? These doubts are common in organizations and range from the operational to the strategic level. Everyone is running out of time to analyze many complex metrics or dashboards.
It is important to know whether a marketing metric delivers results or not. Whether your follow-up is relevant to the business. The conversion rate is a good indicator for executives to look at. For a copywriter, it could be the rejection rate. Or perhaps for the commercial the CPM (or CPA or CPC).
Read also: Digital Marketing Metrics: which ones are important?
Let’s face it: who has time to analyze so many metrics? Even we consultants have our favorites that we use on a daily basis.
The problem is that looking at marketing metrics in isolation can be dangerous. Some hide valuable information that can be used for good decisions. Others can lead to wrong decisions, especially in medium and large companies where responsibilities and decision-making are fragmented.
But then, how to solve this? How to simplify and inform properly?
My suggestion is for you to elect partner metrics for your key marketing metrics. For each key metric, from each level of the organization, locate another metric within the same context to provide the data needed for better analysis.
Identifying Partner Metrics
As mentioned before, it is important to look at the context. The partner metric you are looking for cannot be too far away from the marketing metric you are already looking at. It will depend on the operating segment and also on internal factors such as employees, company size, and incentives to adopt one metric or another.
Let’s take a look at some cases that will help you better understand this method. I will cover examples of acquisition metrics (what we do to attract the visitor), behavior (what happens when the visitor comes to the site), and results (are we making a profit and/or are our customers more satisfied).
CTR & Bounce Rate
When we talk about acquisition metrics we usually think of users, visits, pageviews, etc. An underrated metric is CTR (click-through rate per impression).
Looking at CTR is good because it discourages some of the PPC techniques that look only at ad impressions. In terms of SEO, it shows whether your optimization strategy is targeting the right audience. A good CTR in searches can show which titles and descriptions of your articles are speaking to your target audience.
Perfect, we have a key metric. But what if we are attracting many users to our site but not converting? If users are just logging in but not doing anything? Zero engagement.
We need to look at something else to understand this phenomenon. Here comes our partner metric: bounce rate.
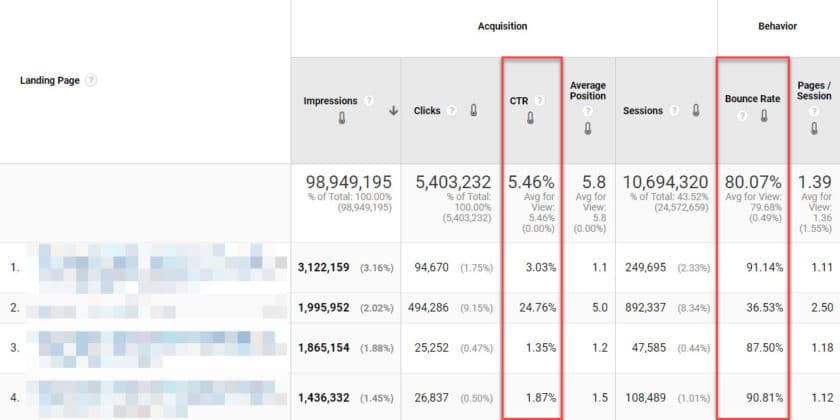
If we look at the bounce rate together with the CTR we get a more assertive view. Those involved (marketing and SEO in our example) will be evaluated for leading the right people through ads and/or content on a page. No false promises. No visitor disappointment.
Other possible partner metrics: average positioning (in organic search), average ad positioning.
Read also: Bounce rate in Google Analytics
Sessions & Users
The dream of every website. Have many visitors.
But is having many visits (sessions) always a positive thing? This view may be mistaken. Often a lower volume of visits can lead to better conversion rates.
A visitor (user) can visit your site 10 times and fail to make a purchase. Is this volume of visits good?
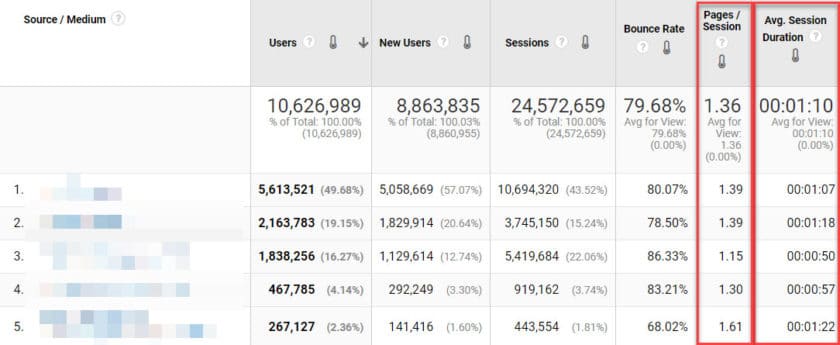
Imagine the following scenario:
- 10 million sessions and 10 million users;
- 10 million sessions and 2 million users.
In the first case we have one session per user. How will the business keep up with this rate? What level of engagement are we promoting?
In the second one we have 5 visits per user. A considerable difference! Can we evaluate return patterns? What is the returner consuming?
See how these marketing metrics go together.
Other possible partner metrics: sessions per user, pages per session.
Also read: What are sessions in Google Analytics?
Session Length & Pages per Session
Session duration… possibly one of the worst digital marketing metrics to track. If you know how Google Analytics calculates this metric you understand what I am saying. In short: time on the last page of a visit is not recorded.
Say a visitor accesses a single page (a bounce), the session length will equal zero. Even if he spent 15 minutes reading some content he still won’t have the session time recorded (except with customizations in tracking).
Many companies put in their media kits the average session length as something “saleable” for sponsors/advertisers. Really?! What value is sold to the partner by saying that a visitor stayed on average 1 minute, 2 minutes, or 5 minutes on the site?
You can have a very well designed landing page, with a super optimized form and a 20% conversion rate where the visitor does everything he wants in 30 seconds. On the other hand, you can have a poorly designed page, that just to read and understand the content the visitor takes 2 minutes and the conversion rate is 2%.
Did you get it? What brings more value? A short and optimized journey or a long and tortuous one?
Okay, what metric can we use to give more context to session length? When you look at the session duration report, what other nearby metrics show up?
How about using pages per session? We can use another indicator if you prefer. It is important to give context to the analysis.
Is a lot of time on the site good? Is a short time good? Is your journey structured according to what you observe by putting these metrics together?
Other possible partner metrics: try using the average page value, it can be enlightening in some cases (especially if the conversion values are properly implemented in Google Analytics).
Conversion Rate & Average Ticket
Who doesn’t like to look at the conversion rate? It is the darling of most analysts (and rightly so) but in many cases it is misinterpreted.
One conversion can be a lot of things, depending on your industry. It can be a lead captured through a form, an online or offline sale, etc. What is important is that it represents money, directly or indirectly.
However, looking only at conversion rate can lead to misinterpretations.
A marketer can be tricked into focusing his efforts on getting simple, low value conversions for the business. The conversion rate will be higher but the financial return will not.
Or, the team can adopt clustering actions such as producing content for a specific niche. Because there is segmentation it is expected that you will have fewer visitors but the volume of conversions remains the same, making it appear that the conversion rate has improved. This may not be a sustainable strategy in the long run.
Read also: Analytics tools: 5 reasons not to use them
Adopting a partner metric like the average ticket can improve our analysis.
Imagine:
- Before: 1% conversion rate and an average ticket of R$200.00. Then: a conversion rate of 1% and an average ticket of R$100.00;
- Before: 1% conversion rate and an average ticket of R$200.00. Then: a conversion rate of 1% and an average ticket of R$300.00.
In the first scenario possibly someone will get a “tug of ears”. In the second scenario we will possibly have someone promoted. Notice that in both cases, if we look only at the conversion rate, we have no way to differentiate a good scenario from a bad one.
Other possible partner metrics: abandonment rate.
Conversion Rate & Task Conversion
This pairing is a bit more complicated. Often the company does not have the resources to track more in-depth qualitative marketing metrics.
As an analytics consultant, I confess that in many cases I find myself with so much to optimize that I end up not paying enough attention to the task conversion rate.
Pairing conversion rate with task conversion helps us to get a view of conversion from both the company’s and the customer’s point of view.
The conversion rate serves the company. It tells you the percentage of users that bought something on your site, for example.
Task conversion serves the customer. It tells you how all the users behaved on the journey.
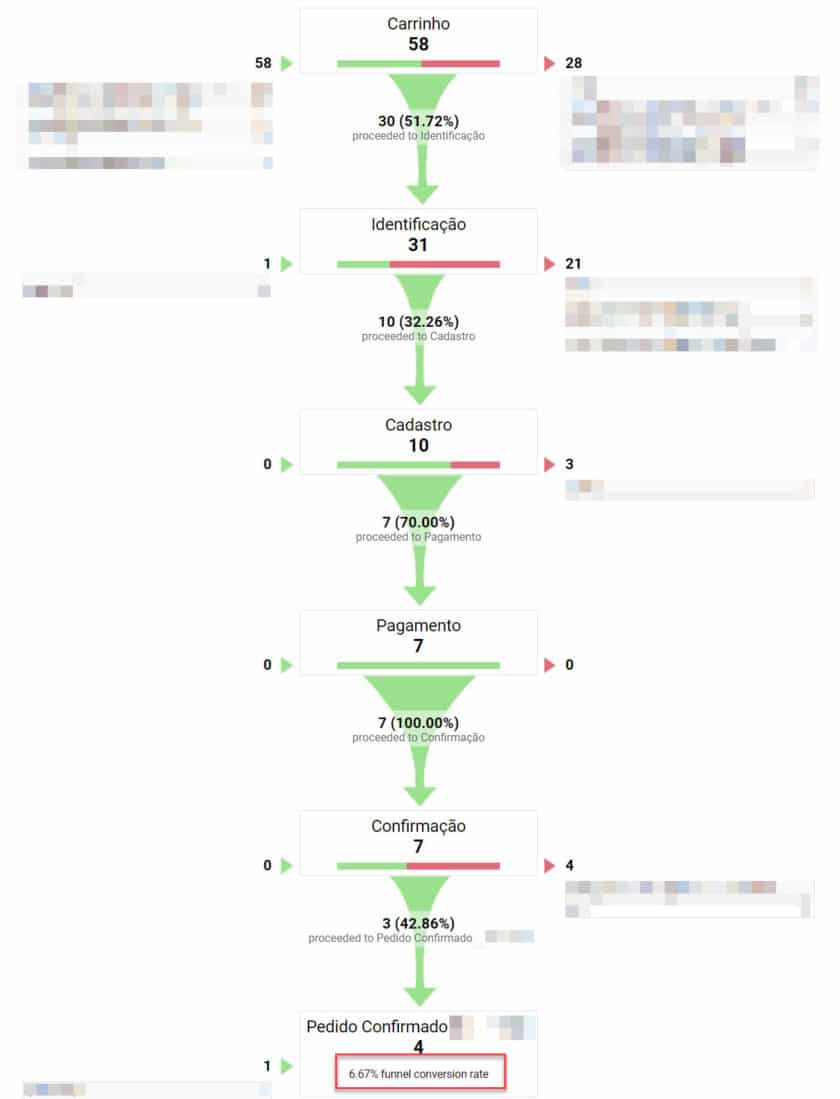
If we have a conversion rate of 1% but a task conversion rate of 10% this is catastrophic. How come only 10% of the users completed their tasks?
A task can be completing a form or the checkout process in an online store (or the sales funnel if you wish). How often we come across funnels that show so much with so little information.
Other possible partner metrics: cost per acquisition.
Revenue & Profit
Wow! Money, money, money, money!
We come to the key point. What executive doesn’t want to look at these metrics?
Unfortunately no analytics tool will help with a proper measurement of the company’s profitability. Maybe you get some information from the finance or accounting department but hardly at a fragmented level that you can send to the analysis tool.
Revenue is the goal of every business. However, many companies have high revenues and still go bankrupt. This is classic: sell your products with insufficient margin to cover costs and expenses and you will break your company.
It is clear that we need a partner marketing metric for revenue. Who better than profit?
Their analysis now shows not only how much the company sold but whether it sold the right products. A revenue of R$ 50 million resulted in a profit of R$ 20 million. You can present an even more granular analysis by stating that the menswear department brought in a revenue of R$20 million but a profit of R$2 million. Meanwhile its children’s fashion department brought in revenues of R$10 million but a profit of R$4 million.
Other possible partner metrics: LTV (Lifetime Value), especially valid for long-term analysis and projections.
Video views & Channel subscribers
Who has never measured the importance of a channel by the volume of views it or its videos have received?
In some respects, such as advertising, it may be that looking at views is interesting. But remember, your YouTube channel does not belong to you, it is a rented space.
What have you done to grow your subscriber base? Your video or live had 3 million views, how many subscribers did you get?
If you can’t get your subscriber base to grow, are you creating long-term relationships or just getting momentary visibility?
Other possible partner metrics: % views (how much of the video was watched), shares.
Likes & Shares
Many analysts, usually the less inexperienced ones, use Facebook likes to measure brand success.
As Avinash Kaushik (Google evangelist) says:
… Likes simply represent people walking by us on the street who smiled at us. They meant nothing more
Just like views on YouTube, likes mean nothing if you are not interested in offering something of quality to your audience and creating a lasting relationship.
But then, if likes are not interesting, how to make this metric a little more valuable?
Look at the shares, for example. Sharing means amplification of reach. The greater the reach of your publications the greater the chances that you will create a relationship with your target audience.
If someone has taken the trouble to share, to endorse a post of yours, it means that there is some degree of affinity with your brand/business.
Other possible partner metrics: comments.
App Installations & Active Users
One metric to track when talking about apps is the number of installs.
It is estimated that 80-90% of downloaded applications are used only once. In this case, it is important to have a metric to better contextualize whether an app is succeeding or not.
A good alternative is to take a look at the users active in the last 30 days. You can look at other periods (7 or 14 days for example) as long as it is aligned with your business.
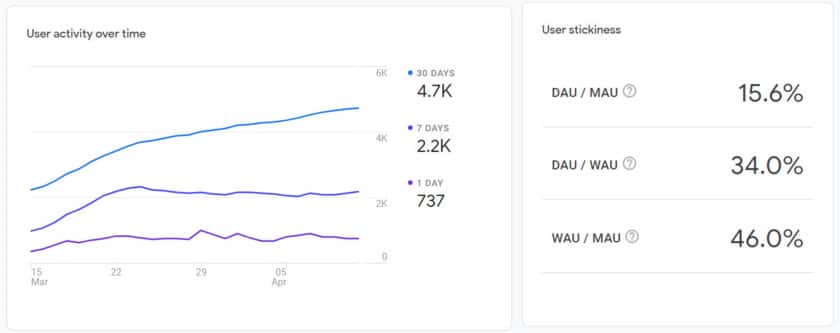
Now we are not only concerned about who downloaded the app, but also about who used it. This is important for your business.
Other possible partner metrics: first app opening, app removals.
Conversions & Assisted Conversions
Whenever we look at conversions we want to know where they are coming from. Which acquisition channels are being more efficient and delivering better results.
A critical problem is that most tools (and analysts) tend to report only the conversions attributed to the last click.
It is as if you spent a month evaluating the purchase of a new car. Day after day you research the car, talk to mechanics, ask friends for recommendations, watch reviews on YouTube until you decide to buy it. He leaves home towards the dealership and on the way he hears an advertisement on the radio that further endorses the purchase. You buy the car and as if by magic all the credit for the sale goes to the salesman who attended you at the dealership…

It makes no sense!!!
One metric that is directly linked to conversions is assisted conversions. Assisted conversions help identify how many times an acquisition channel participated in the customer journey to conversion, not being the last interaction channel (or last click in the case of an online conversion).
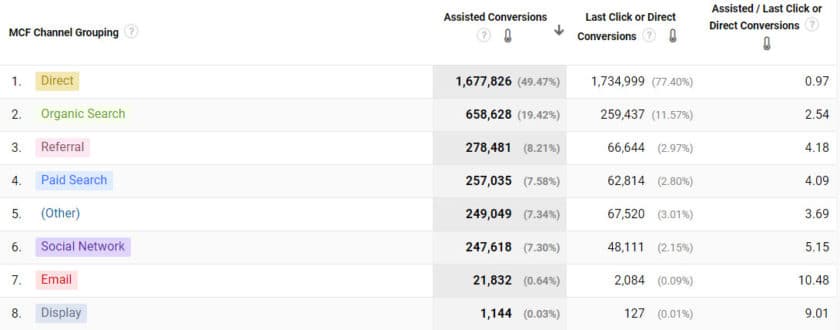
Now you will be able to really analyze what contribution each channel makes to your customer’s buying process. This will allow you to optimize your campaigns assertively, generating better results.
Since a good portion of the readers who have made it this far are Google Analytics enthusiasts, I recommend that they delve into GA’s attribution models.
In conclusion
In this article I suggested adopting partner marketing metrics to contextualize and complement your analysis based on your key metrics.
I have presented some pairs of metrics as follows:
- CTR & Bounce Rate
- Sessions & Users
- Session Length & Pages per Session
- Conversion Rate & Average Ticket
- Conversion Rate & Task Conversion
- Revenue & Profit
- Video views & Channel subscribers
- Likes & Shares
- App Installations & Active Users
- Conversions & Assisted Conversions
Try to present your key metrics together with partner metrics in your dashboards/reports. They will provide a more complete picture of your business and lead to better decisions.
Do you have a combination of metrics that you think is relevant? Get in touch or talk to me on social media.
Continue reading: Is real time analytics really that important?