
Anyone who has navigated Google Analytics has already come across a catch-all of variables in the reports. Google Analytics reports consist of a grouping of metrics and dimensions. To create a custom report in Google Analytics or Google Data Studio you are free to combine metrics and dimensions freely. But beware! You may be creating an unusable report. In this post I will show you the difference between dimensions and metrics and what to look for when combining them in a report.
Index
What are dimensions in Google Analytics
All the data you see in a Google Analytics report is a dimension or a metric. Google explains dimension as follows:
Dimensions are attributes of your data.
In short, dimensions are a description, a feature, functionality or aspect of your data. It is a qualitative variable of how a metric happened on your site. Some examples of dimensions:
- City
- Device
- Page
- Origin/Media
Notice that the dimensions appear as words, not numbers. Of course we have dimensions like time and date for example that are expressed in numbers but still are a characteristic of what is happening on the site (sessions per time of day for example).
You can see the dimensions in the first column of your reports:
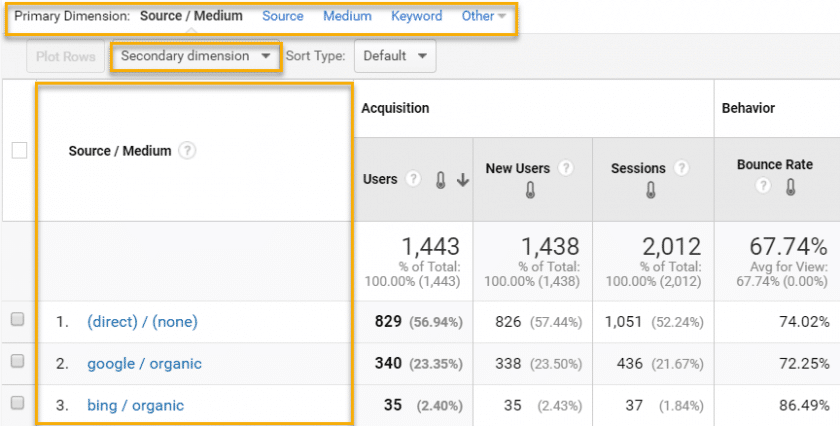
The reports also give you the option to select other dimensions, and there are several. Do a test, go to the Acquisition > Source/Media report and click on the Secondary Dimension button:
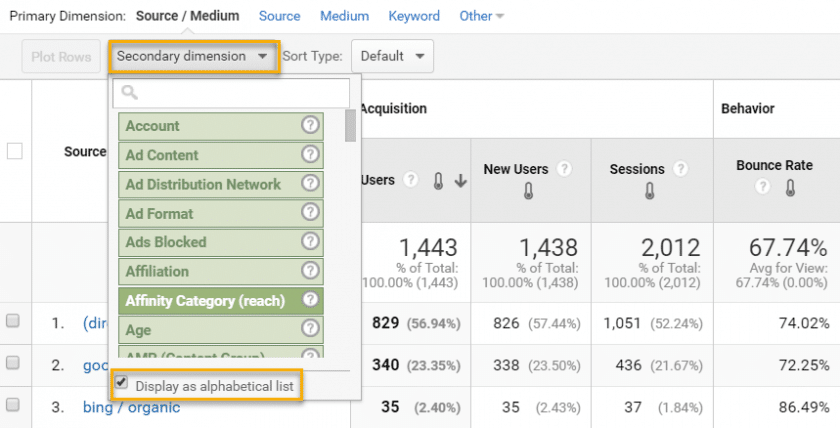
When you click to display in alphabetical order you will see the variety of dimensions that can be part of a report. It is a good way to get acquainted with dimensions.
You can for example choose “Device Category” or “User Type” to better understand what devices your users are using or whether they are returning to your site.
But before you run the tests on Google Analytics, what other question are you waiting for an answer to?
What are metrics in Google Analytics
Metrics are the numbers you see in each dimension. They show what the user did inside the site, in numbers. See for example the Behavior report > All Pages:
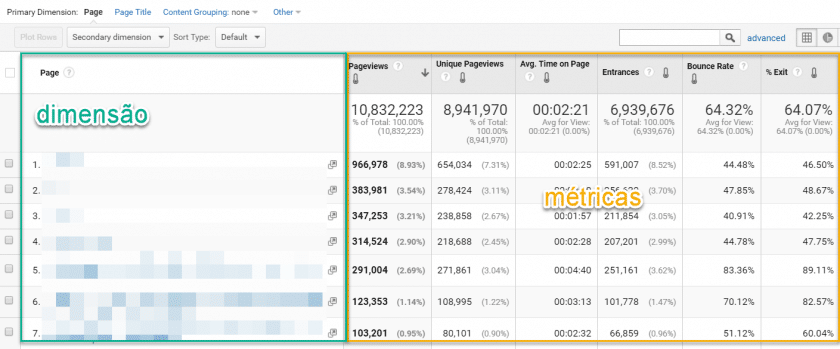
In the example above, Page is the dimension and pageviews, entries, etc. are the metrics.
Metrics need dimensions to be contextualized otherwise they are just numbers.
By default Google Analytics does not allow you to add a secondary metric, because not all metrics are collected for all dimensions. It may sound confusing but it gets less complicated if you know how Google Analytics collects data.
What is scope in Google Analytics?
Have you ever wondered why Google Analytics displays some dimensions and metrics but others are left out of the reports? This is because Google Analytics does not want to combine them, this could show erroneous results and lead to incorrect analysis and decisions about the collected data. But why is this so? Why does Google Analytics avoid some combinations of dimensions and metrics? This is related to how Google Analytics processes data: scope. Each dimension and metric can have only one type of scope which can be:
- Hit
- Session
- User
- Product
Scope Hit
Every time a user does something on your site, it will send data to Google Analytics, a hit. Each action is stored. The hit scope is the lowest level of data storage. A page is a hit-level dimension, as are the language and the page title. Page views, time on page, load time, and total events are examples of hit-level metrics.
Examples of hit scope:
| Dimensions | Metrics |
| Page | Pageview |
| Hostname | Time on page |
| Event Category | Total Events |
Also read: What are pageviews in Google Analytics
Session Scope
The session scope is more time-based and is one level higher than the hit level. A session consists of occurrences that happen in only one session for the same user. Examples of dimensions on a session level are source/media, landing page, and device category. Examples of session-level metrics are sessions, bounce rate, outputs, goals, and page views per session.
Session scope examples:
| Dimensions | Metrics |
| Entry Page | Sessions |
| Source/Media | Dropout Rate |
| Campaign | Average session duration |
Also read: What are sessions in Google Analytics?
User Scope
The user scope is the highest level at which the data is organized. Users can have more sessions and a session can have more hits. Examples of dimensions that belong to the user scope are user type, days since last session and gender. Examples of user-level metrics are users, new sessions, and percentage of new sessions.
Examples of user scope:
| Dimensions | Metrics |
| User Type | Users |
| Session count | New Users |
| Geographical location |
Product Scope
The product type scope relates to all information about a product.
To learn a bit more about scope watch the video below from Measureschool:
Combining dimensions and metrics
Session level dimensions and metrics contain information about specific sessions. If you decide to combine pages with sessions in a custom report because you want to know how many sessions a page received during a period, you may find something different than you expect:
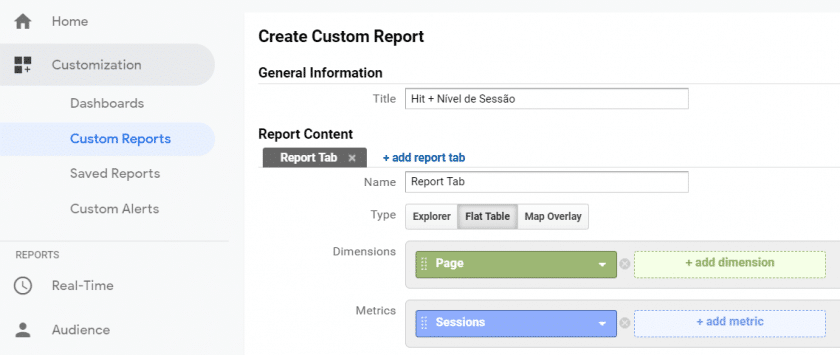
This report will show you something like:
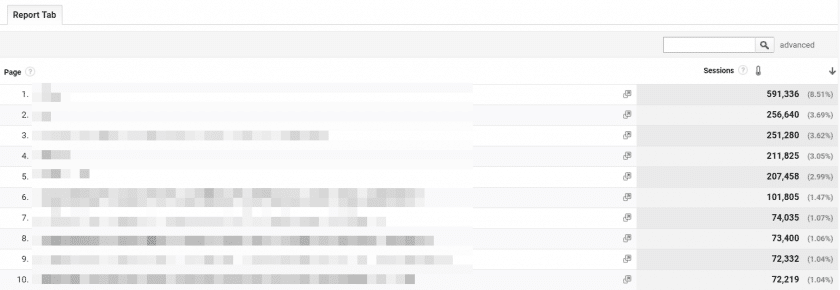
If you think that page 1 has been viewed 591,336 times you are mistaken. What you are seeing is how many sessions started with page 1, because this is the first hit of the session.
There are some frequent mistakes that are made when combining dimensions and metrics that are explained in more detail by Bounteous.
You cannot combine dimensions and metrics that do not share the same scope. But how do you know which metrics and dimensions can be combined into a custom report in GA? Google provides a metrics and dimensions explorer. On this page you can find all dimensions and metrics. It may not be a very intuitive tool at first, but you get used to it.
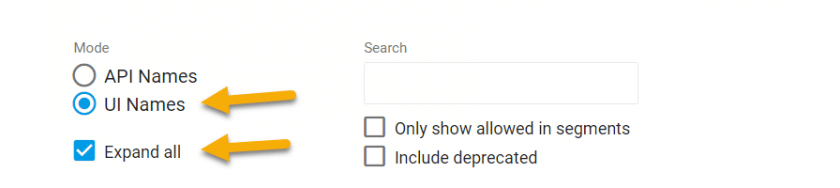
Start by checking the two fields above and everything is easier. Click in the box of a dimension or metric and those that do not share the same scope will already be displayed in gray. Still it is not a foolproof tool. If you choose “sessions”, “pageviews” is not grayed out (and they are not of the same scope). So it is up to you to know whether the metric and dimension you are choosing for your report share the same scope.
Conclusion
When creating custom reports, segments, or using custom dimensions and metrics, think first about what you want to measure. Think about what level or scope your dimensions and metrics are at. And think about whether this all makes sense. In general, if you want to add the metric “sessions” to a custom report, stick to the scope at the session level. And don’t combine hit-level variables with session-level variables.
Continue reading: Nomenclature in Google Analytics and Tag Manager
Continue reading: Marketing Metrics: Partner Metrics